How to Analyze KPIs for Your App

How to Analyze KPIs for Your App
Contributed ContentThe path to a profitable app involves tracking key performance metrics and using them to iterate a more successful version, keeping in mind what you’ve learned. Based on our experience at Designli, an app design studio that focuses on startups, this article will show you what characterizes a successful app has, how to conduct an analysis on your app, and how to iterate based on what you’ve learned.
Minimum viable products (MVPs) are launched based on a series of researched assumptions.
It’s impossible to know precisely what will resonate in the marketplace, so you start with an educated guess. Over time, you track key metrics and then integrate your learnings into the next version of the app.
About 25% of users abandon an app after the first use. Users are interested enough in an app to download it onto their device, yet they abandon it right away. The key to success and profitability for any app is to identify the “why” behind user actions and to iterate accordingly.
This article includes what we have found provides the best success rates post-launch — establishing the right metrics to track and steps to leverage those learnings for continued profitability.
How to Measure KPIs for Your App:
- Choose which KPIs to evaluate, such as number of users, session length, time in app, and user retention.
- Conduct an analysis of the KPIs, including creating a tracking system, establishing goals, and connecting how each metric impacts your goals.
- Apply your learnings from your analyses. This includes identifying and addressing your weak points.
Choose Which KPIs Will Evaluate App Success
In order to determine if an app is successful, you need to measure its performance in a few important areas. Using key performance indicators (KPIs) is the standard way of performing this analysis.
Although there are an unlimited number of metrics you can measure, it’s best to focus on a few that make the biggest impact on an app’s success. Here are the most important ones for you to consider:
1. Number of Users
This fundamental metric helps you create a historical record of growth. Be sure to track active users, particularly if your app uses any other monetization model besides pay-to-download.
Depending on what’s applicable to your app, you might also want to consider tracking upgrades, subscriptions, sessions, and daily active users (DAU).
2. Session Length
Session length is the time between when an app is opened and when it is closed. It is an indication of the time your users spend in your app each time they open it.
This metric can be especially valuable when comparing session length to the length of time it takes to perform key tasks on your app. For example, if checkout takes five minutes but your average session length is shorter, you know you need to simplify the checkout process or find a way to encourage users to stay in the app longer.
3. Time in App
This metric measures the total amount of time a user was in your app over an extended period of time.
It helps you understand how often your app is used and the engagement level of your users. This metric can be reviewed over time to reveal trends and patterns of use.
4. Retention
Retention, also called cohorts, tracks your most valuable and engaged users over time. This metric is the percentage of users returning to your app based on the date of their first visit.
Monitoring retention helps you discover what is working and what isn’t. It’s especially useful to track after updates are made to your app.
Analyzing retention with other aspects such as device, operating system, and location can help you improve the user experience with your app.
5. Acquisition
Acquisition is the number of users who download and install your app by location source such as organic search through a browser or through social media.
It is especially useful when running campaigns, as it tracks what it costs to acquire users and what people do once they are in your app.
This helps you determine your return-on-investment (ROI), another useful metric.
6. Lifetime Value (LTV)
Lifetime value represents how much each user is worth in their lifetime relative to the overall app revenue or profit. It can be tracked over time to reflect user or customer worth and provides insight into loyalty.
LTV can also be analyzed relative to acquisition, or how a user found the app, to show how much more spending can increase users by the channel and still make a profit.
The average revenue per user and customer acquisition cost are two other useful related financial metrics.
7. Session Interval
Session interval is the length of time between uses of the app, and it shows how often users go into your app. It can be especially helpful in determining if improvements can be made in the design or screen flow of your app on various devices or with general usability.
It could also highlight an opportunity for a strategic approach to notifications or email.
In addition to these KPIs, ratings and reviews are especially helpful for getting feedback on your app. You’ll want to take note of the volume as well as the content of reviews and ratings.
And, remember, reviews can be housed in multiple places such as iTunes, Google Play, Google Analytics, the App Store, and others, depending on your app and the operating system it was developed for.
Tracking these KPIs will give you valuable data on your app’s performance and reveal areas for improvement.
Conduct a KPI Analysis
Identifying KPIs is only the first step in understanding performance. Your next step is to conduct an analysis. Here’s how.
1. Create a Tracking System
Once you’ve determined the KPIs you want to track, you need to set up a system to regularly record these metrics.
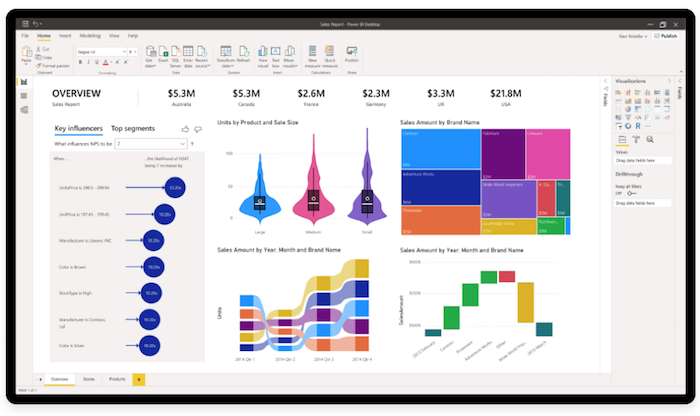
Dashboards can be built using robust platforms such as Microsoft Power BI.
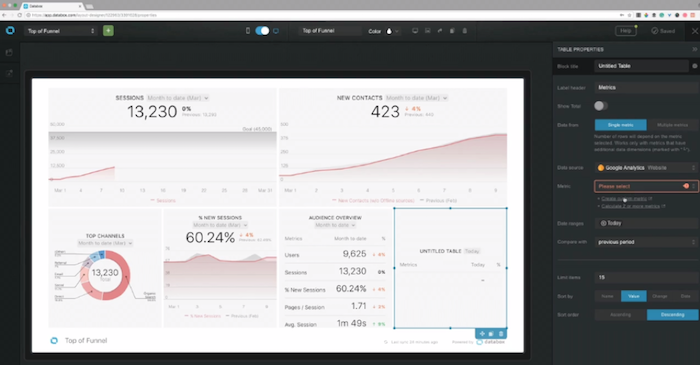
You can also use simple software such as Databox to build a dashboard.
A tracking system will help you measure the metrics in one place.
2. Establish Goals
With a tracking system in place, you’ll then establish your business goals.
Do you want to increase revenue by a certain percentage? Improve your CLV? Figure out what you want to accomplish.
3. Connect How Each Metric Impacts Each Goal
Next, you’ll determine how each of the metrics or combination of metrics influences each goal. This will help you determine what targets you need to hit for each KPI.
For example, your goal may be to increase overall revenue by 10% during the year. In order to achieve that, you want to know the CLV of your users, how long a user typically stays in the app before making a purchase, etc.
4. Create Your KPI Targets
Once you’ve lined up how your KPIs influence your goals, you’re ready to create your KPI targets, identifying benchmarks that you’ll try to hit over the next six months to year.
5. Run Periodic Analyses
Your next step is to determine how often you’ll run an analysis.
If you’re preparing to launch a new version, you’ll, of course, conduct an analysis prior to development, but there are other times that it’s beneficial to analyze performance — for example, when you’re running a marketing campaign.
We recommend conducting an analysis on a monthly basis to stay informed on performance and to identify weaknesses as soon as they become apparent.
Note that all of the KPIs we’ve identified provide valuable insights independently but also, especially, together. Being able to see how one set of data relates to others is key to your analysis.
As you’re running periodic analyses, look for correlations in your data over time. Although correlation does not imply causality, it offers important clues.
Running an analysis on a regular basis will give you the insights you need to improve your performance.
Apply Learnings From Your KPI Analyses
After running your KPI report and conducting your analysis to identify trends, patterns, and correlations, you’re ready to apply what you’ve learned. Here’s an easy-to-follow process for doing this.
1. Identify Your Weak Points
Looking at your KPI metrics relative to your targets, where, specifically, are you failing?
Create a list of all the weak points.
2. Match Functionality With Weak Points
Identify the functionality associated with each weak point.
For example, if users start a checkout but often abandon it, you know there’s a problem with the checkout process.
3. Brainstorm New Functionality or Features to Address Weak Points
The insights from your analyses can inform redesigns, screen flow, and usability changes. They can lead you to build stronger sales funnels that entice your users down the path to purchase.
For example, if your time in app drops off after users hit the one-month mark, you know that you need to provide a more compelling reason for users to stay engaged long term — or maybe you need to build in habit-forming features such as leaderboards or the ability to earn badges.
Messaging campaigns by email and in-app can also improve via insights that you can derive by actively monitoring KPIs relative to the benchmarks you set.
Using these insights to inform redesigns, UX changes, messaging campaigns, and building stronger funnels will boost your success.
The Key to a Successful App Is Analyzing Key Metrics to Inform Decisions
Once you build an app, your job is just beginning on the quest to make it profitable for the long term. It’s important to track performance and iterate as needed in order for your app to be successful.
Start by determining the key performance indicator metrics and your definition of good performance in benchmarks that you will measure against. Track performance relative to the benchmarks, conduct analysis, and then use your insights to improve your app.
This cycle of continuous improvement is the secret to success.

Keith Shields
Partner, Designli