How to Track Your Social Media Campaign Results

How to Track Your Social Media Campaign Results
Contributed ContentTracking the performance of social media campaigns can give companies greater insight into how their audience is engaging with and reacting to content and help in crafting more effective campaigns in the future.
Did you know that measuring social ROI is currently one of the biggest challenges for brands and marketers? A Convince and Convert study found that 58.7% of social media marketers find it challenging to assess their ROI. As a result, they often fail to get the most out of their social media campaigns because they don’t know what’s working and what’s not.
This is problematic because these campaigns have the potential to boost social presence, attract a highly relevant audience, and multiply revenue. In fact, a Clutch survey found that social media has a positive influence on the revenue and sales of 52% of businesses.
Although the remaining 48% feel that it has limited impact, they still find that it requires management. And perhaps with a more effective analysis of their campaign results, they could find ways to derive an even bigger impact through their social media efforts.
Measuring campaign results will help you understand what to optimize, where you’re making mistakes, and more. So, in the following list, we’ll walk through some of the ways to track your social media campaign’s performance.
1. Track Your Engagement Rate
The first thing you can track is the engagement rate for your campaign-related posts. This will help you understand how responsive people are to the content, giving you a fair idea of what appeals to them. You can then optimize your campaign using the type of posts that have higher engagement rates.
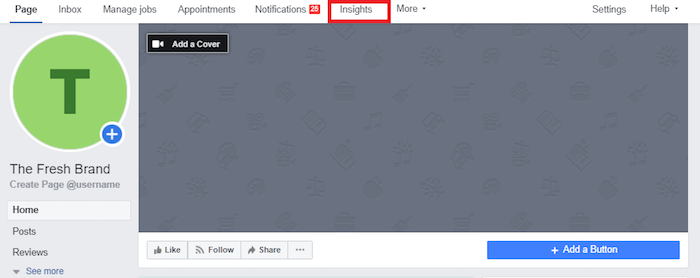
On Facebook, you can view this data by clicking on “Insights” at the top of the page.
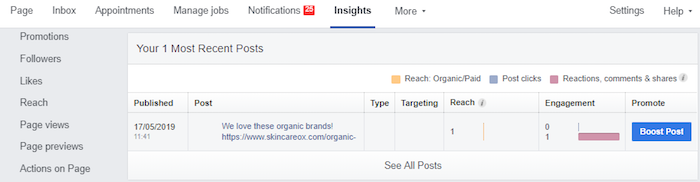
Under this section, you can see the number of engagements for each post.
What’s great about Facebook is that you also get to see the different kinds of reactions on each post, giving you a better idea of whether people liked, loved, or hated the content.
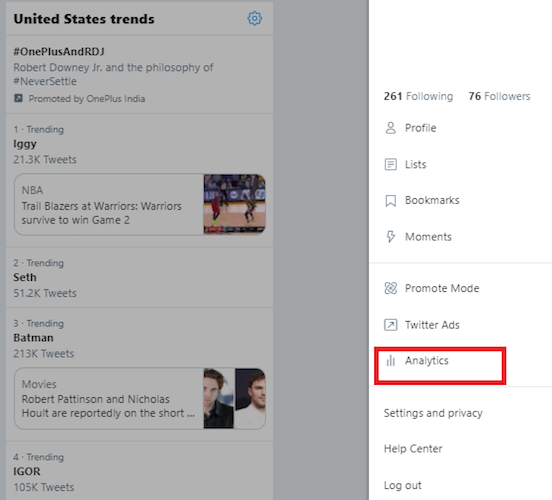
On Twitter, clicking your profile icon at the top of the page will pull up your “Account Info” on the right. From here, click on “Analytics” to access your data.
The next page will give you an overview of your performance during the month such as tweet impressions, profile visits, followers gained, etc.
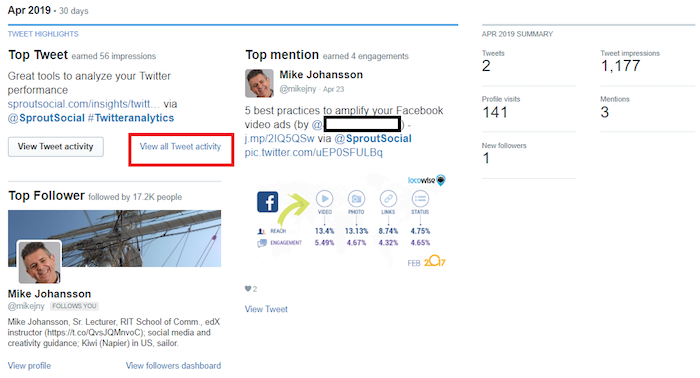
Click on “View all Tweet activity” under your “Top Tweet.” Here, you’ll be able to get a clear idea of how each individual Tweet performed in terms of impressions and engagement.
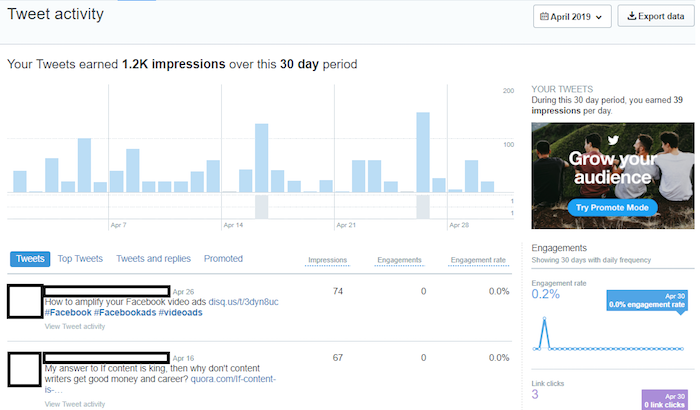
As an example, the image above shows the engagement rate for two different posts over a period of 30 days.
By determining the engagement rates on specific posts, you can optimize your campaign to include only content that appeals to your audience.
2. Track Your Referral Traffic
Another important metric to understand social media campaign results is your referral traffic from social media. While engagement rates tell you a bit about what your audience likes, they don’t really show you what actions users take afterward — or if they take any action at all. Here are a few ways you can measure that data.
Google Analytics can give you an overview of how much traffic is coming from social media; however, that’s not enough to understand the impact of individual posts. Most of your social traffic may even come from organic posts, rather than your sponsored posts. Without this information, you may be spending your money to boost posts that don’t really deliver.
To get a more accurate picture of how each post is driving traffic to your site, you can combine your links with UTM tracking parameters. UTM, or Urchin Tracking Module, are unique parameters that you assign to your links so you can easily track the source of your traffic.
Each post — whether organic or sponsored — will have a unique UTM that looks something like this.
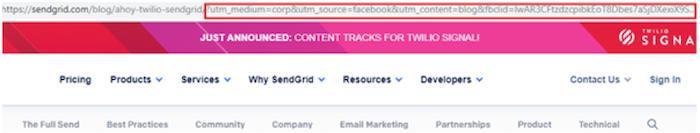
By tracking this UTM parameter, you can see how much traffic this post is driving and how much revenue you can attribute to it.
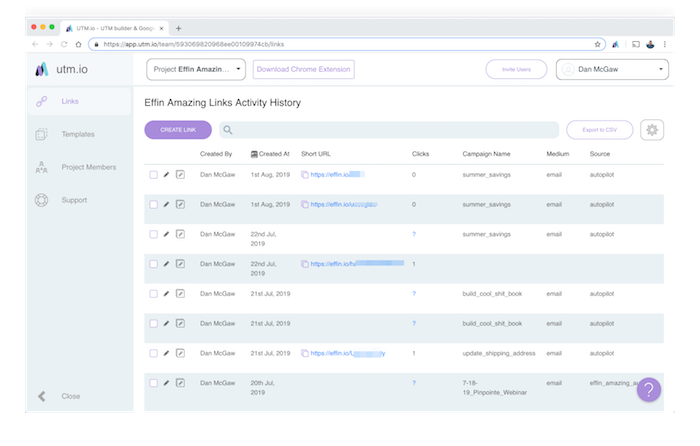
Some social media marketers still avoid using UTM parameters to track their campaigns because it’s a bit challenging to create one. You can simplify your UTM creation process by using tools like UTM.io.
Start by clicking on the “Project” tab at the top left-hand corner of the UTM.io dashboard. Here you’ll get the option to “Create Project.” Just add the project name and team members, then click on “Create Link” just below the project name.
After filling in the basic fields above, you’ll be prompted to give a bit of additional information necessary to create the UTM link. The form fields are pretty much self-explanatory—enter the URL, campaign name, medium, and source. The other fields are optional, based on your personal needs and preferences.
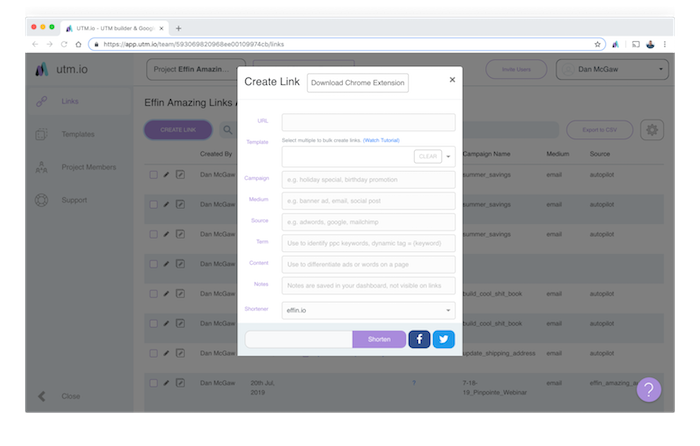
After you enter the required details, the tool will automatically add a relevant UTM parameter to your URL at the bottom of the page, shown above.
By using a UTM parameter to track your campaign, you’ll have a better read on how your posts are impacting traffic rates.
3. Track Your Reach and Impressions
How many people did your campaign reach? Looking at your number of impressions will help you understand your campaign’s impact on brand visibility both within and outside of your existing audience base. This way, you can understand how much value you’re getting out of your investment.
Your reach and impressions also give you some insight into how engaging your posts are. When people interact with your posts, their activity might show up in their connections’ feeds and increases your reach. So, a more expansive reach and a higher number of impressions usually mean that your posts are engaging your audience.
On Facebook, you can view your post reach by clicking on “Reach” under “Insights”, demonstrated in the image below.
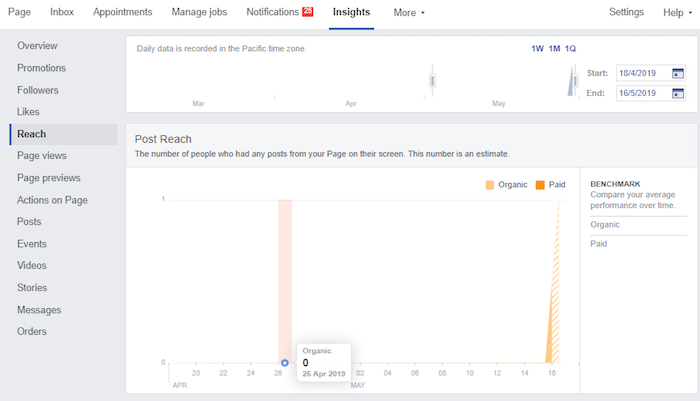
This view will show you how much reach you garnered for both organic and paid posts.
On Twitter, you can find an estimate of your total Tweet impressions in your Analytic summary at the top of the page.
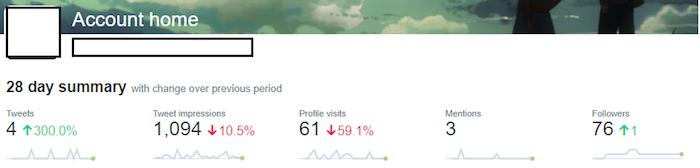
As shown in the image above, Twitter also measures the percentage of increase or decrease in impressions.
On both Facebook and Twitter, this data allows you to understand how successfully your campaign is reaching your audience, driving engagement, and generating interest in your brand.
4. Track Follower Growth
Of course, reach and impressions alone aren’t enough to help you understand how your campaign increased interest in your brand or products. The number of followers you’ve gained since you launched your campaign is another tell-tale sign of its success.
If you’re getting a lot of impressions but little engagement and zero new followers, there might be something wrong with the copy or offer. Aside from engagement, you’ll have to measure how many people decided to follow you on social media after seeing your campaign, giving some insight into how it has contributed to increased interest in your brand.
It's important to understand your follower growth rate before starting a campaign. You can use native social media analytics to get an estimate. If you have an idea of how many followers you gain regularly, you can get a more accurate reading of the impact your campaign is having on your average follower growth rate.
With Facebook, you’ll see an in-depth analysis by tracking the number of followers you gained organically against those gained through paid promotions.
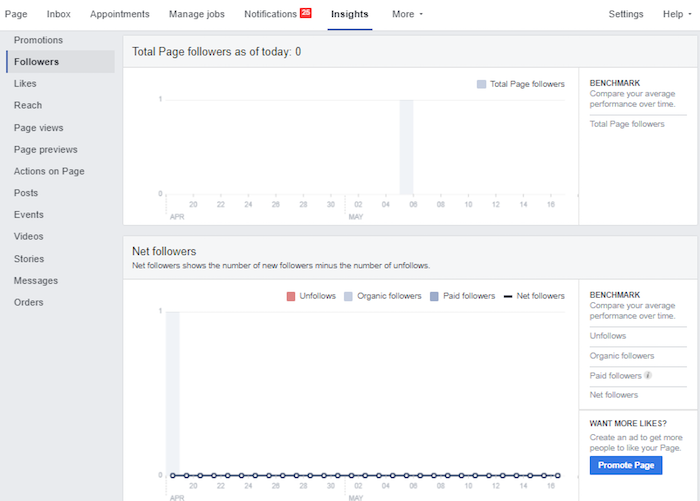
The view above details trends in your number of followers both daily and overtime, which provide insight into a social media campaign’s success.
5. Measure Brand Sentiment
Is your campaign affecting how people feel about your brand? Is it resulting in a high amount of negative backlash? Or are you becoming more appealing to consumers?
Measuring brand sentiment before and after your social media campaign is an excellent way to understand your campaign’s impact.
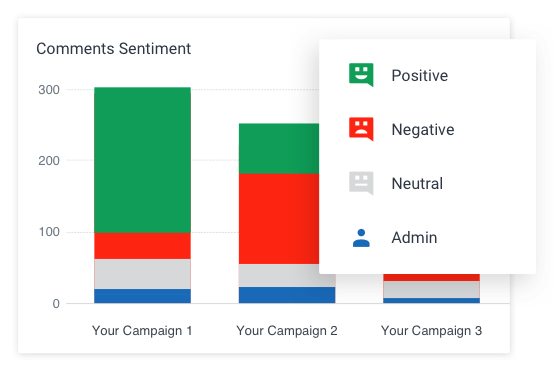
The Socialbakers Social Media Sentiment Analysis tool is perfect for this. It goes through the responses in your posts and campaigns to understand how people feel about them. It will show you the number of positive, negative, and neutral comments for each campaign in a color-coded graph.
With this information, you might get some valuable customer feedback to help improve your efforts. At the very least, you’ll have a better idea of which efforts aren’t working and which ones are improving your brand visibility.
Tracking Social Media Campaigns Is Worth Your Time
These are some of the metrics and tools you can use to measure the performance of your social media campaigns and gain a better understanding of your audience.
You can dive deeper into the metrics above to identify common elements in successful campaigns and unsuccessful ones. That way, you’ll know exactly how to optimize your future campaigns and generate a better ROI.

Shane Barker
Digital Marketing Consultant
Shane Barker is a digital marketing consultant for 15 years with an emphasis on Influencer Marketing in the last 5 years. He is specialized in sales funnels, targeted traffic, and website conversions. He has consulted with Fortune 500 companies, influencers with digital products, and a number of A-List celebrities.