14 Key App Metrics You Need to Track for Your Mobile App

14 Key App Metrics You Need to Track for Your Mobile App
How well is your mobile app really performing? These essential engagement and profitability metrics are the best way to find out.
How do you really find out if your mobile app is doing well?
The answer is simple: data.
Just like any other marketing channel, mobile comes with a set of metrics that help marketers differentiate between success and failure.
It’s crucial to track and analyze these metrics because they help you understand how users interact with your app and why.
They can also help you discover if your app is making money.
Why is that necessary? Because you need to fully understand how your mobile app performs before you can improve it.
“But there’s so much data out there – daily active users (DAU), monthly active users (MAU), return on investment (ROI) – what’s more important?”
For someone who is new at mobile app analytics, it’s easy to get confused. Especially with all those acronyms. But don’t worry, that’s why we are here to narrow it down for you.
This article will help you discover some of the key metrics you should track for your mobile app, along with steps on how to measure them.
We will cover:
- Usage & Engagement Metrics
- Profitability Metrics
- The Golden Metric
App Usage and Engagement Metrics
Fun fact: 25% of downloaded mobile apps only get used once.
With increasing competition in the mobile app market, it’s important for marketers to understand how people engage with their app and what makes them continue to use it.
You can easily track most of the essential usage and engagement metrics using popular mobile app analytics tools like Google Analytics, Kissmetrics, Flurry, Mixpanel, or Localytics.
In this section, we will cover some of the key usage and engagement metrics you need to track for your mobile app.
1. Downloads and Installs
You should always know how many people have installed your app.
However, keep in mind that this metric alone will never be able to tell you about the real success of your mobile app. What if users downloaded your app because of a certain marketing campaign and never used it again or uninstalled it right away?
Still, the number of app installs is important because it lays the foundation for all other metrics you should track and analyze.
How to Track App Downloads and Installs
You can easily set up app install tracking using Google Analytics for both Android and iOS. Here is a step-by-step guide on how to do that.
2. App Acquisition
So, you know how many people download your app. But, do you know where those downloads came from? That’s what app acquisition tells you.
App acquisition shows the effectiveness of your marketing campaigns and channels and will help you make the most of your marketing spend.
For example, if you’re running multiple ads or campaigns, this metric will help you find what’s working and what’s not, so you can focus on investing in the problem areas.
How to Track App Acquisition
You can track app user acquisition through Google Analytics, or use business analytics platform Mixpanel instead.
Here’s how Mixpanel typically categorizes the campaign source of your users:
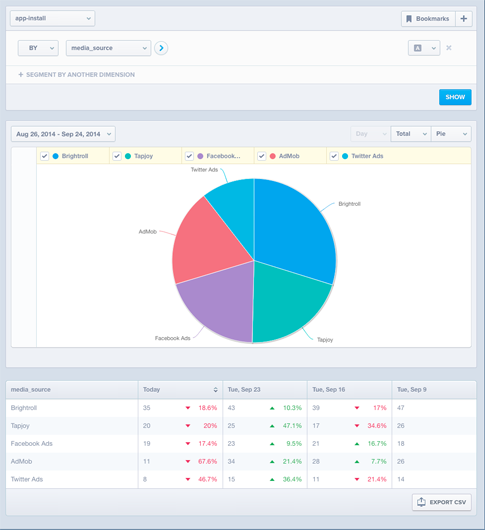
The graph shows how app users found your app – Facebook ads, Twitter ads, AdMob, Brightroll, Tapjoy.
3. Active Users
Not all people who download your app are active users. Active users regularly open and engage with your app.
This metric is important because it shows how engaging and useful your app is to users.
So, what classifies a user as “active”? It depends on the analytics tool you use.
According to Google Analytics, an active user is one who has opened and interacted with an app within the last 30 days.
Active users can be segmented into Daily Active Users (DAU) and Monthly Active Users (MAU).
- DAU measures the number of users who have a session with your app at least once a day
- MAU is the number of users who have a session at least once a month
How to Track Active App Users
You can measure DAU and MAU using most analytics tool.
Here is how Google Analytics typically shows active mobile app users:
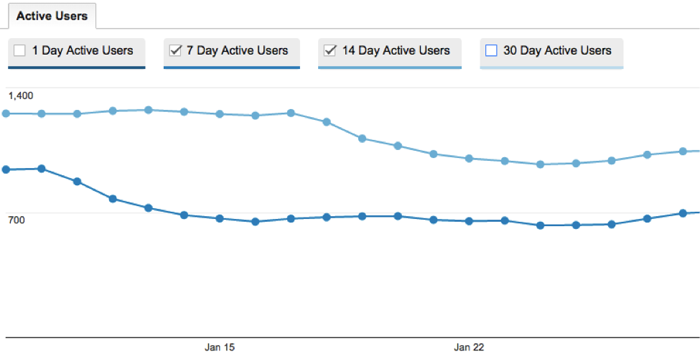
The dark blue line shows 7-day active users, or the number of unique users who initiated sessions on your site or app over the last 7 days. The light blue line shows 14-day active users.
4. Stickiness
The stickiness ratio shows how often users come back to your app.
To calculate stickiness, you just divide the DAU by the MAU. Multiply the result by 100 to get a percentage.
How to Track App Stickiness
Stickiness = (Daily Active Users / Monthly Active Users ) x 100
The higher the percentage, the better. It means you have more MAUs sticking around long enough to become DAUs.
5. Average Daily Sessions Per Daily Active User (DAU)
Average daily sessions per DAU shows how many times on average users open and engage with your app in one day.
So, what’s a good number of average daily sessions per daily active user? It depends.
Social media apps such as Facebook, Instagram or WhatsApp want their users to have a higher number of daily sessions on average.
Other apps that don’t need to be used as much to be successful may be happy with a lower number.
How to Track Average Daily Sessions Per DAU
Average Daily Sessions Per DAU = Number of Daily Sessions / Number of DAU
6. Average Session Length
The average app session length tells you how much time a typical user spends interacting with your app in a single session.
This metric is important because it tells you how engaged your users are. For example, if you have an e-commerce app, are users browsing products for longer periods of time? Or, do they close the app after just a few seconds?
How to Track Average App Session Length
You can track average session length using Google Analytics or any other analytics tool. Here is how to use Google Analytics to track average app session.
7. Screen Flow
Screen flow analysis breaks down how users interact with your app, screen-by-screen.
Here is what a typical report looks like:
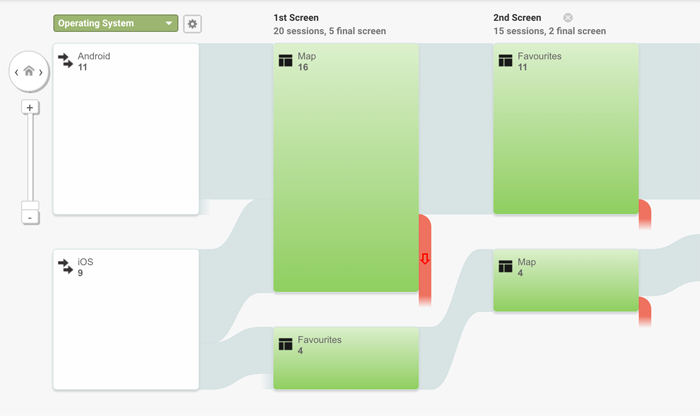
For example, you can track exits by screen, find out the navigation path users take through different screens, and the total number of visits for each screen.
Screen flow highlights the problem areas in your app, such as the screen users interact with before they exit your app.
You can use this data to improve the problem areas and re-engage lost users.
How to Track App Screen Flow
Google Analytics is a great tool to help you track screen flow.
8. Retention Rate
App retention rate measures how many users return to your app after using your app at another time. Simply put, retention measures how many users you retain after a set period of time.
People get bored easily. Retaining app users over time is one of the biggest challenges on your way to success.
This metric also may be useful if you implement new features or release a new update. It can help you find out if the new updates or features are keeping users engaged or driving them away.
How to Track App Retention
App Retention Rate % = (Number Users Retained at End of Time Period / Total Users at Start of Time Period ) x 100
You can also check out this step-by-step guide on how to measure retention with Google Analytics.
9. Churn Rate
App churn rate is the opposite of retention rate.
It tells you how many users stopped using your app after a given time.
How to Track App Churn Rate
1 – Retention Rate = Churn Rate
Profitability Metrics
Track how much money you make with your mobile app.
Here are some key profitability metrics you should track for your mobile app.
10. Average Revenue Per User (ARPU)
This metric tells you how much revenue is being generated on average by each user in the form of subscriptions, in-app purchases, paid downloads, ad clicks, or any other app monetization channel.
This figure is important because it tells you the overall value a single user brings to your app.
How to Track Average Revenue Per User (ARPU)
Average Revenue Per User (ARPU) = Total App Revenue in Given Time / Number Users in Given Time
11. Cost Per Acquisition (CPA)
In the beginning, it might seem like the total number of downloads or conversions are enough to tell you how well your app is performing.
But you need to know how much acquiring new users costs as well.
How to Track Cost Per Acquisition (CPA)
Cost Per Acquisition (CPA) = Total Cost of Campaign / Total Acquisitions or Conversions
12. Return On Investment (ROI)
ROI measures the money you make (return) on the money you spend building and marketing your app.
How to Track App ROI
App Return on Investment (ROI) % = (Gain From investment – Cost of Investment ) / Cost of Investment) x 100
13. Lifetime Value (LTV)
App lifetime value (LTV) helps you identify how much value each customer brings to your app.
Remember, your LTV should always be greater than your CPA. If it isn’t, it probably means you are paying too much for your customers.
The average number of years a customer stays with you, also known as the average customer lifetime, varies depending on the type of customers you have.
For example, if your target customers are aged 18-24, they might grow out of that age group after 4 or 5 years on average.
How to Track App Lifetime Value (LTV)
App Lifetime Value (LTV) = Average Value of Conversion x Average Number of Conversions x Average Customer Lifetime
14. The ‘Golden’ Metric
No matter how many metrics you track, the app star rating is by far the most important (and obvious) one. You should focus on ways to increase mobile app reviews.
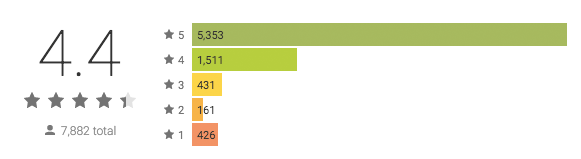
People almost always check an app’s rating before they decide to download it.
Regardless of how much you invest in all other aspects of your app, if it’s poorly rated on the App Store or Google Play, it will end up driving potential users away.
Focus on the Metrics That Matter
Going through mobile analytics might seem easy, but you need to really understand what you’re looking for before you dive into the data.
Be clear on the goals you set for your app, and don’t waste too much time on metrics that don’t matter. Try to focus only on the key areas that help you achieve your goals.

David 'DJ' Oragui
Founder & Lead Growth Engineer at Grow Hack Scale, Balanced Narrative and Balanced Life Academy Group., Grow Hack Scale